SIEM Solution: Installing and Configuring Suricata IDS with Elastic Stack on Ubuntu

SIEM Solution:
Suricata is a network monitoring tool that inspects and processes all internet traffic passing through your server. It can create log events, trigger alerts, and block traffic when it detects suspicious activity.
You can install Suricata on a single machine to monitor its traffic or set it up on a gateway host to scan all incoming and outgoing traffic from other connected servers. Combining Suricata with Elasticsearch, Kibana, and Filebeat creates a powerful Security Information and Event Management (SIEM) system.
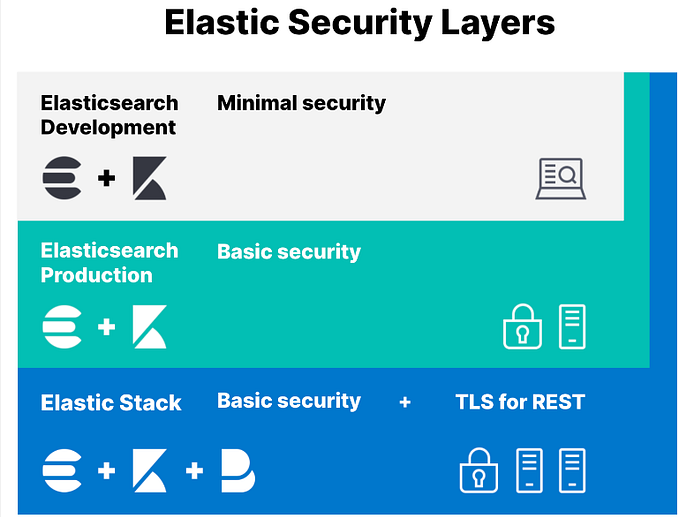
In this tutorial, you will install Suricata IDS and the Elastic Stack on an Ubuntu 22.04 server. The components of the stack are as follows:
- Elasticsearch: Stores, indexes, correlates, and searches the security events from the server.
- Kibana: Visualizes the logs stored in Elasticsearch.
- Filebeat: Parses Suricata’s eve.json log file and sends each event to Elasticsearch for processing.
- Suricata: Monitors network traffic for suspicious events and drops invalid packets.
The tutorial is divided into five parts:
- Installing and Configuring Suricata:
- Set up Suricata to scan network traffic for suspicious events and drop invalid packets.
2. Installing and Configuring Elastic Stack:
- Install Elasticsearch and Kibana on a separate server to store and visualize security events.
3. Configuring Filebeat:
- Parse Suricata’s eve.json log file and send events to Elasticsearch for further processing.
4. Accessing Kibana Dashboard
- Set up and customize dashboards in Kibana to effectively monitor and analyze the security logs.
5. Managing Kibana Dashboards
· Managing Kibana Dashboards involves organizing visual representations of data in Kibana to facilitate effective monitoring and analysis.
We will install Suricata and the Elastic Stack on different servers to simulate a real-world deployment scenario.
Prerequisites
- The servers hosting the Elastic Stack and Suricata should have a minimum of 4GB RAM and 2 CPU cores.
- The servers should be able to communicate using private IP addresses.
- The servers should be running Ubuntu 22.04 with a non-root sudo user.
- If you want to access Kibana dashboards from everywhere, set up a domain (kibana.example.com) pointing to the server where Elasticsearch will be installed.
Install essential packages on both servers. Some of them may already be installed.
sudo apt install wget curl nano software-properties-common dirmngr apt-transport-https gnupg gnupg2 ca-certificates lsb-release ubuntu-keyring unzip -yMake sure everything is updated on both servers.
sudo apt updatePART 1
Step 1 — Install Suricata
Official website link: https://docs.suricata.io/en/latest/quickstart.html
To install Suricata, you must add the Open Information Security Foundation’s (OISF) package repository to your server.
sudo add-apt-repository ppa:oisf/suricata-stableInstall Suricata.
sudo apt install suricataBefore proceeding ahead, stop the Suricata service since we need to configure it first.
sudo systemctl stop suricataStep 2: Configure Suricata
Suricata stores its configuration in the /etc/suricata/suricata.yml file. By default, Suricata operates in Intrusion Detection System (IDS) mode, which logs traffic without blocking it. For beginners, it is recommended to keep this default setting. Once you become more familiar with Suricata and its configuration, you can switch to Intrusion Prevention System (IPS) mode to actively block suspicious traffic.
HOME_NET:
Identify Your System’s IP Address:
Run the following command to display your network interfaces and IP addresses:
Ip a sNote the IP address of your network interface (e.g., eth0, wlan0, ens33).
Replace the existing value with your IP address or network range:

Network Interface:
AF-PACKET:
The default Suricata configuration file inspects traffic on the eth0 device/network interface. If your server uses a different network interface, you will need to update that in the configuration.
Use Ctrl + W to search for the keyword af-packet. This will help you quickly find the relevant section in the configuration file. And change the interface name:

If you want to add additional interfaces, you can do so by adding them at the bottom of the af-packet section at around line 650.
To add a new interface, insert it just above the — interface: default section as shown below.
We have added a new interface ens33 and a unique value for the cluster-id variable. You need to include a unique cluster ID with every interface you add.

specifying network interfaces for packet capture (pcap):

Enable Community ID:
Enabling the Community ID field in Suricata enhances the ability to correlate data across different monitoring tools, especially when importing logs in JSON format into Elasticsearch. This integration allows for seamless data analysis and correlation across diverse security events and sources.
Locate the line # Community Flow ID and set the value of the variable community-id to true.

Step 3: Configure Suricata Rules:
By default, Suricata uses a limited set of rules to detect network traffic. To enhance its capabilities, you can add more rulesets from external providers using a tool called Suricata-update.
Add Ruleset Providers:
To expand Suricata’s rule set, you can integrate additional providers offering a wide range of free and commercial rule sets. This allows Suricata to fetch rules from diverse sources to enhance its capability in network traffic detection and analysis
sudo suricata-update list-sources
If you want to include the etnetera/aggressive ruleset, you can enable it with the following command.
sudo suricata-update enable-source etnetera/aggressive
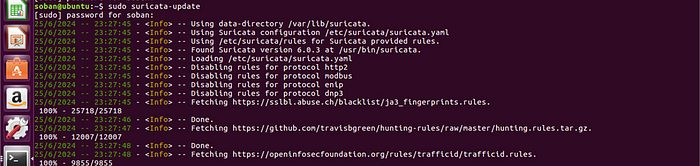
Run Suricata-update to download and update new rules; Suricata can process rule changes dynamically without requiring a restart.
Step 4: Verify Suricata Configuration:
Suricata includes a validation tool to ensure the configuration file and rules are error-free. Run the following command to execute the validation tool:
sudo suricata -T -c /etc/suricata/suricata.yaml -vThe -T flag directs Suricata to operate in testing mode, while -c specifies the configuration file’s location. The -v flag enables verbose output, essential for detailed command feedback. Depending on your system’s setup and the rule count, execution may require several minutes.

Step 5 — Running Suricata
Now that Suricata is configured and set up, it is time to run the application.
$ sudo systemctl start suricataCheck the status of the process.
$ sudo systemctl status suricata
You can monitor the log file for that using the following command.
$ sudo tail -f /var/log/suricata/suricata.logIf you see the following line in the log file, it means Suricata is running and ready to monitor network traffic.

Step 6: Testing IDS Functionality with a Signature
To verify the IDS functionality of Suricata, it’s recommended to test with a specific signature. Use the signature with ID 2100498 from the ET Open ruleset, designed for such test cases.

To verify whether Suricata detected the simulated traffic, you should check the log file using the specific rule number (2100498 in this case) from the ET Open ruleset. This will indicate if Suricata identified and logged the activity matching the signature used in testing.
grep 2100498 /var/log/suricata/fast.log
Step 7: Adding Custom Rules in Suricata:
Use a text editor like nano to create or edit the local.rules file. This file is where you can add your custom Suricata rules.
Sudo nano /etc/suricata/rules/local.rulesRule:
alert icmp any any -> $HOME_NET any (msg:"icmp pinging" ; sid:1; rev:1;)Explanation:
alert: Specifies that this is an alert rule, which means Suricata will generate an alert when the conditions are met.
ICMP: Specifies the protocol being monitored, in this case, ICMP.
any any -> $HOME_NET any: Defines the traffic flow:
any any: Matches any source IP address and any source port.
->: Indicates the direction of traffic.
$HOME_NET any: Specifies the destination as the $HOME_NET, which typically represents the internal network.
msg: Provides a descriptive message that will accompany the alert when triggered (“ICMP pinging” in this case).
sid: Unique ID assigned to the rule (SID 1 in this example).
rev: Rule revision number (Revision 1 in this example).

Adding Rule path in the config file:(after adding then verify it through the command in step 4):

Check the Log after ping from another like Windows or another server:
Sudo cat /var/log/suricata/fast.log
Step 8: Installing jq for Interpreting Suricata Logs:
To read and interpret Suricata events logged in JSON format at /var/log/suricata/eve.log, you need to install jq, a command-line tool for parsing JSON data
Install jq using the following command:
Sudo apt install jqTo see the Logs in eve.json:
sudo tail -f /var/log/suricata/eve.json | jq 'select(.event_type=="alert")'
PART 2
Setting Up the ELK Stack:
Having completed part one with Suricata installation and testing, part two involves deploying the ELK (Elasticsearch, Kibana) stack on a separate server. This setup centralizes and visualizes Suricata logs for effective network security monitoring and incident analysis.
Install Prerequisites:
On the second server first to update and upgrade a system:
Sudo apt update && sudo apt upgradeYou may need to install the “apt-transport-https” package on Debian before proceeding:
sudo apt-get install apt-transport-httpsimport the Elasticsearch PGP key:
sudo wget -qO - https://artifacts.elastic.co/GPG-KEY-elasticsearch | sudo gpg --dearmor -o /usr/share/keyrings/elasticsearch-keyring.gpgThen add the Elasticsearch repository to your sources list:
Sudo echo "deb [signed-by=/usr/share/keyrings/elasticsearch-keyring.gpg] https://artifacts.elastic.co/packages/7.x/apt stable main" | sudo tee /etc/apt/sources.list.d/elastic-7.x.listUpdate your system’s repository list.
sudo apt updateInstall Elasticsearch:
sudo apt install elasticsearch -yshow the Private IP of the server:
ip -brief address showlo is the private IP and the rest of ens33 is your public IP:

Step 9 — Configure Elasticsearch:
Elasticsearch stores its configuration in the /etc/elasticsearch/elasticsearch.yml file. Open the file for editing.
Cluster Setting:
Change with their server’s name:

Path setting:

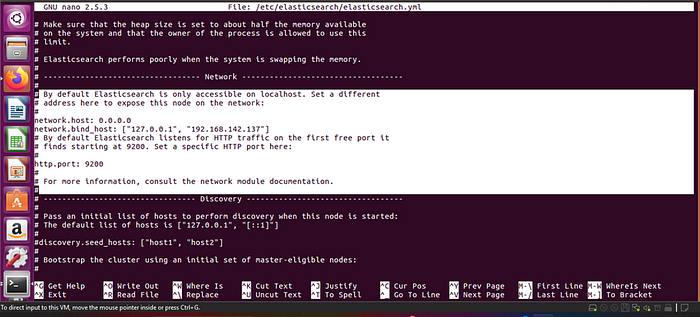
Network setting:
To make Elasticsearch accessible from other hosts:
Adding the following lines:
· network.host: “0.0.0.0” (for remote connections):
· network.bind_host : [“127.0.0.1”, “public IP”] (here put the localhost(private IP) as well as public IP):
· enable http.port:9200
The next step is to turn on some security features and ensure that Elastic is configured to run on a single node. To do that, add the following lines at the end of the file.
discovery.type: single-nodexpack.security.enabled: trueOnce you are finished, save the file by pressing Ctrl + X and entering Y when prompted.
Configure Firewall:
Add the proper firewall rules for Elasticsearch so that it is accessible via the private network.
Make sure you choose the right interface name:
sudo ufw allow in on ens33sudo ufw allow out on ens33Start Elasticsearch:
Reload the service daemon.
sudo systemctl daemon-reloadNow that you have configured Elasticsearch, it is time to start the service.
sudo systemctl start elasticsearchCheck the status of the service:
sudo systemctl status elasticsearch
Create Elasticsearch Passwords:
After enabling security settings in Elasticsearch, the next step is to generate passwords for the default users. Elasticsearch includes a password creation utility located at: /usr/share/elasticsearch/bin/elasticsearch-setup-passwords that can generate random passwords.
Create the passwords.
Note: You can only run the utility once, so save all the passwords in a secure location.
cd /usr/share/elasticsearch/binsudo ./elasticsearch-setup-passwords autoYou will get an output like the following. Press y to continue when prompted.

Verify Elasticsearch Installation:
Check if Elasticsearch is running correctly open the browser and write “http://127.0.0.1:9200”:

Step 10– install and configure Kibana:
Import the Kibana public GPG key and add the Kibana repository to your package sources:
Sudo wget -qO - https://artifacts.elastic.co/GPG-KEY-elasticsearch | sudo gpg --dearmor -o /usr/share/keyrings/elasticsearch-keyring.gpgsudo echo "deb [signed-by=/usr/share/keyrings/elasticsearch-keyring.gpg] https://artifacts.elastic.co/packages/7.x/apt stable main" | sudo tee /etc/apt/sources.list.d/elastic-7.x.listInstall Kibana:
Update your package lists and install Kibana:
Sudo apt updateSudo apt install kibana -yHere the first step in configuring Kibana is to enable the X-Pack security feature by generating secret keys. These keys are used by Kibana to securely store data in Elasticsearch. The utility to generate secret keys is in the /usr/share/kibana/bin directory.
· -q: Suppresses the command instructions.
· — force: Ensures fresh secrets are generated.
cd /usr/share/kibana/bin/sudo ./kibana-encryption-keys generate -q --force
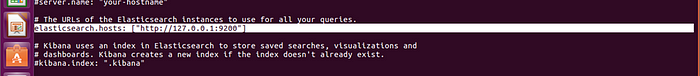
Copy the output. Open Kibana’s configuration file at /etc/kibana/kibana.yml for editing.
Paste the code from the previous command at the end of the file.
sudo nano /etc/kibana/kibana.ymlconfiguration Settings: (server. port, server. host, Elasticsearch. host)


Step 11: Configure Kibana Access:
The next step is to create a username and password that Kibana can use for authentication. You can do that by directly editing Kibana’s configuration file, but it can cause a security issue. The secure method involves the use of “kibana-keystore” application.
Run the following commands to set a username. Enter” kibana_system” as the username.
cd /usr/share/kibana/bin$ sudo ./kibana-keystore add elasticsearch.username
Run the command again to set the password. Make sure you use the password you created for Kibana in step 9.
sudo ./kibana-keystore add elasticsearch.password
Start and Enable Kibana Service:
Start the Kibana service and enable it to start on boot:
sudo systemctl enable kibana –nowsudo systemctl start kibanasudo systemctl status kibana
Step 12: Access Kibana:
Kibana runs on port 5601 by default. To access Kibana, open a web browser and navigate to:
“http://<your_server_ip>:5601”
http:// <your_server_ip>:5601Firewall Configuration:
Ensure your firewall allows traffic on the necessary ports. If you are using ufw (Uncomplicated Firewall), run:
sudo ufw allow 9200/tcp # Elasticsearchsudo ufw allow 5601/tcp # KibanaPART 3:
Step 13: Install and Configure Filebeat:
Prerequisites
- Ensure you have two Ubuntu servers ready:
- Suricata + Filebeat Server: 192.168.142.135 (server public IP)
- Elasticsearch + Kibana Server: 192.168.142.137 (server public IP)
Note: We will install Filebeat on the Suricata server. Switch back to the Suricata server and add the Elastic GPG key and Repository to get started and update it.
Sudo wget -qO - https://artifacts.elastic.co/GPG-KEY-elasticsearch | sudo gpg --dearmor -o /usr/share/keyrings/elasticsearch-keyring.gpgSudo echo "deb [signed-by=/usr/share/keyrings/elasticsearch-keyring.gpg] https://artifacts.elastic.co/packages/7.x/apt stable main" | sudo tee /etc/apt/sources.list.d/elastic-7.x.listsudo apt updateInstall Filebeat.
sudo apt install filebeat -yFilebeat stores its configuration in the etc/filebeat/filebeat.yml file. Open it for editing.
sudo nano /etc/filebeat/filebeat.ymlFirst, connect Filebeat to Kibana’s dashboard. Locate the line #host: “localhost:5601” in the Kibana section of the Filebeat configuration file and add the Kibana server public IP:

Next, locate the Elasticsearch Output section in the Filebeat configuration file. Edit the hosts, username, and password fields as follows. For the username, choose elastic as the value, and for the password, use the value generated in step 9 of this tutorial.

Once you are finished, save the file by pressing Ctrl + X and entering Y when prompted.
Next, enable Filebeat’s built-in Suricata module.
sudo filebeat modules enable suricata
The final step in configuring Filebeat is to load the SIEM dashboards and pipelines into Elasticsearch using the Filebeat setup command:
sudo filebeat setup
Step 4
Step 14: Accessing Kibana Dashboard:
Kibana is configured to access Elasticsearch via its private IP address, you have two options to access it. The first method is to use an SSH tunnel to the Elasticsearch server from your PC. This will forward port 5601 from your PC to the server’s private IP address, allowing you to access Kibana from your PC at http://localhost:5601. However, this method restricts access to your PC only.
The other option is to install Nginx on your Suricata server and use it as a reverse proxy to access Elasticsearch via its private IP address. We will discuss both methods, and you can choose the one that best suits your requirements.
Using SSH Local Tunnel:
If you are using Windows 10 or Windows 11, you can run the SSH LocalTunnel from your Windows Powershell. On Linux or macOS, you can use the terminal. You will probably need to configure SSH access if you haven’t already.
Run the following command in your computer’s terminal to create the SSH Tunnel.
· your_username is your SSH username for the Elasticsearch server.
· your_public_IP is the public IP address of your Elasticsearch server.
· -N flag tells SSH not to execute any command but to keep the tunnel open.
Keep this terminal window open. As long as this command is running, you can access Kibana by opening http://localhost:5601 in your web browser.
Sudo ssh -L 5601:192.168.142.137(your kibana server IP):5601 your_username@your_public_IP -N
Step 15: Using Nginx Reverse-proxy:
This method is best suited if you want to access the dashboard from anywhere in the world.
Configure Firewall:
Before proceeding further, you need to open HTTP and HTTPS ports in the firewall.
sudo ufw allow httpsudo ufw allow httpsInstall Nginx
Ubuntu 22.04 ships with an older version of Nginx. To install the latest version, you need to download the official Nginx repository.
Import Nginx’s signing key.
curl https://nginx.org/keys/nginx_signing.key | gpg --dearmor \| sudo tee /usr/share/keyrings/nginx-archive-keyring.gpg >/dev/nullAdd the repository for Nginx’s stable version.
echo "deb [signed-by=/usr/share/keyrings/nginx-archive-keyring.gpg arch=amd64] \http://nginx.org/packages/ubuntu `lsb_release -cs` nginx" \| sudo tee /etc/apt/sources.list.d/nginx.listUpdate the system repositories.
sudo apt updateInstall Nginx.
sudo apt install nginxVerify the installation.
nginx -vStart the Nginx server.
sudo systemctl start nginxsudo systemctl status nginx
The first step is to install the Let’s Encrypt SSL certificate. To do this, we need to install Certbot to generate the SSL certificate. Certbot can be installed either from Ubuntu’s repository or by using the Snapd tool. In this guide, we will use the Snapd version to ensure we have the latest version.
sudo snap install core && sudo snap refresh coreInstall Certbot.
sudo snap install --classic certbotUse the following command to ensure that the Certbot command can be run by creating a symbolic link to the /usr/bin directory.
sudo ln -s /snap/bin/certbot /usr/bin/certbotGenerate the SSL certificate for your domain (replace kibana.example.com with your actual domain and name@example.com with your email):
sudo certbot certonly --nginx --agree-tos --no-eff-email --staple-ocsp --preferred-challenges http -m name@example.com -d kibana.example.comThe above command will download a certificate to the /etc/letsencrypt/live/kibana.example.com directory on your server.
Generate a Diffie-Hellman group certificate:
sudo openssl dhparam -dsaparam -out /etc/ssl/certs/dhparam.pem 4096To check whether the SSL renewal is working fine, do a dry run of the process.
sudo certbot renew --dry-runIf you see no errors, you are all set. Your certificate will renew automatically.
Step 16: Configure Nginx:
Create and open the Nginx configuration file for Kibana.
sudo nano /etc/nginx/conf.d/kibana.confAdd the following configuration (replace 192.168.142.136 with your Elasticsearch server's private IP and kibana.example.com with your domain):
server {
        listen 80; listen [::]:80;
        server_name kibana.example.com;
        return 301 https://$host$request_uri;
}

server {
        server_name kibana.example.com;
        charset utf-8;

        listen 443 ssl http2;
        listen [::]:443 ssl http2;

        access_log /var/log/nginx/kibana.access.log;
        error_log /var/log/nginx/kibana.error.log;

        ssl_certificate /etc/letsencrypt/live/kibana.example.com/fullchain.pem;
        ssl_certificate_key /etc/letsencrypt/live/kibana.example.com/privkey.pem;
        ssl_trusted_certificate /etc/letsencrypt/live/kibana.example.com/chain.pem;
        ssl_session_timeout 1d;
        ssl_session_cache shared:MozSSL:10m;
        ssl_session_tickets off;

        ssl_protocols TLSv1.2 TLSv1.3;
        ssl_ciphers ECDHE-ECDSA-AES128-GCM-SHA256:ECDHE-RSA-AES128-GCM-SHA256:ECDHE-ECDSA-AES256-GCM-SHA384:ECDHE-RSA-AES256-GCM-SHA384:ECDHE-ECDSA-CHACHA20-POLY1305:ECDHE-RSA-CHACHA20-POLY1305:DHE-RSA-AES128-GCM-SHA256:DHE-RSA-AES256-GCM-SHA384;

  resolver 8.8.8.8;

        ssl_stapling on;
        ssl_stapling_verify on;
        ssl_dhparam /etc/ssl/certs/dhparam.pem;

        location / {
                proxy_pass http://your_private_IP:5601;
                proxy_set_header Host $host;
                proxy_set_header X-Real-IP $remote_addr;
                proxy_set_header X-Forwarded-For $proxy_add_x_forwarded_for;
                proxy_set_header X-Forwarded-Proto $scheme;
        }
}
Save the file by pressing Ctrl + X and entering Y when prompted.
Open the file /etc/nginx/nginx.conf for editing.
sudo nano /etc/nginx/nginx.confAdd the following line before the line includes /etc/nginx/conf.d/*.conf;
server_names_hash_bucket_size 64;Save the file by pressing Ctrl + X and entering Y when prompted.
Verify the configuration.
sudo nginx -t

//this is the output of the command :
nginx: the configuration file /etc/nginx/nginx.conf syntax is ok
nginx: configuration file /etc/nginx/nginx.conf test is successful
Restart the Nginx service.
sudo systemctl restart nginxYour Kibana dashboard should be accessible via the URL https://kibana.example.com from anywhere you want.
PART 5:
Step 17: Managing Kibana Dashboards:
Before proceeding further with managing the dashboards, you need to add the base URL field in Kibana’s configuration.
Open Kibana’s configuration file.
sudo nano /etc/kibana/kibana.ymlFind the commented line #server.publicBaseUrl: “and change it as follows by removing the hash in front of it.
server.publicBaseUrl: https://kibana.example.com (your domain name)Save the file by pressing Ctrl + X and entering Y when prompted.
Restart the Kibana service.
sudo systemctl restart kibanaload the URL https://kibana.example.com in your browser OR your public IP (http://192.168.142.137:5601) in your browser. Log in with the username elastic and the password you own generated before like (bd1YJfhSa8RC8SMvTIwg) and you will get the following screen.

Type: data Suricata in the search box at the top to locate Suricata’s information.

Clicking the first result ([Filebeat Suricata] Alert Overview) displays a screen like the following. By default, it shows entries for the last 15 minutes, but you can adjust the timespan to view more data.
Alerts:

Events:

Networks:
Rules:
Conclusion:
In conclusion, deploying an SIEM solution in a small organization is not just about compliance or meeting industry standards. It’s a proactive measure that enhances security visibility, improves incident response capabilities, and ultimately protects the organization’s valuable assets and reputation. By leveraging open-source tools like Elasticsearch and Kibana alongside network monitoring tools like Suricata and Filebeat, small organizations can achieve robust cybersecurity defenses that scale with their growth and operational needs.